

dbt transformation
Configure a dbt transformation in Keboola — connect a remote warehouse or use Keboola Storage, link the dbt project repository, define execution steps, set freshness and output mapping, and run or debug it.
Configuration
Section titled “Configuration”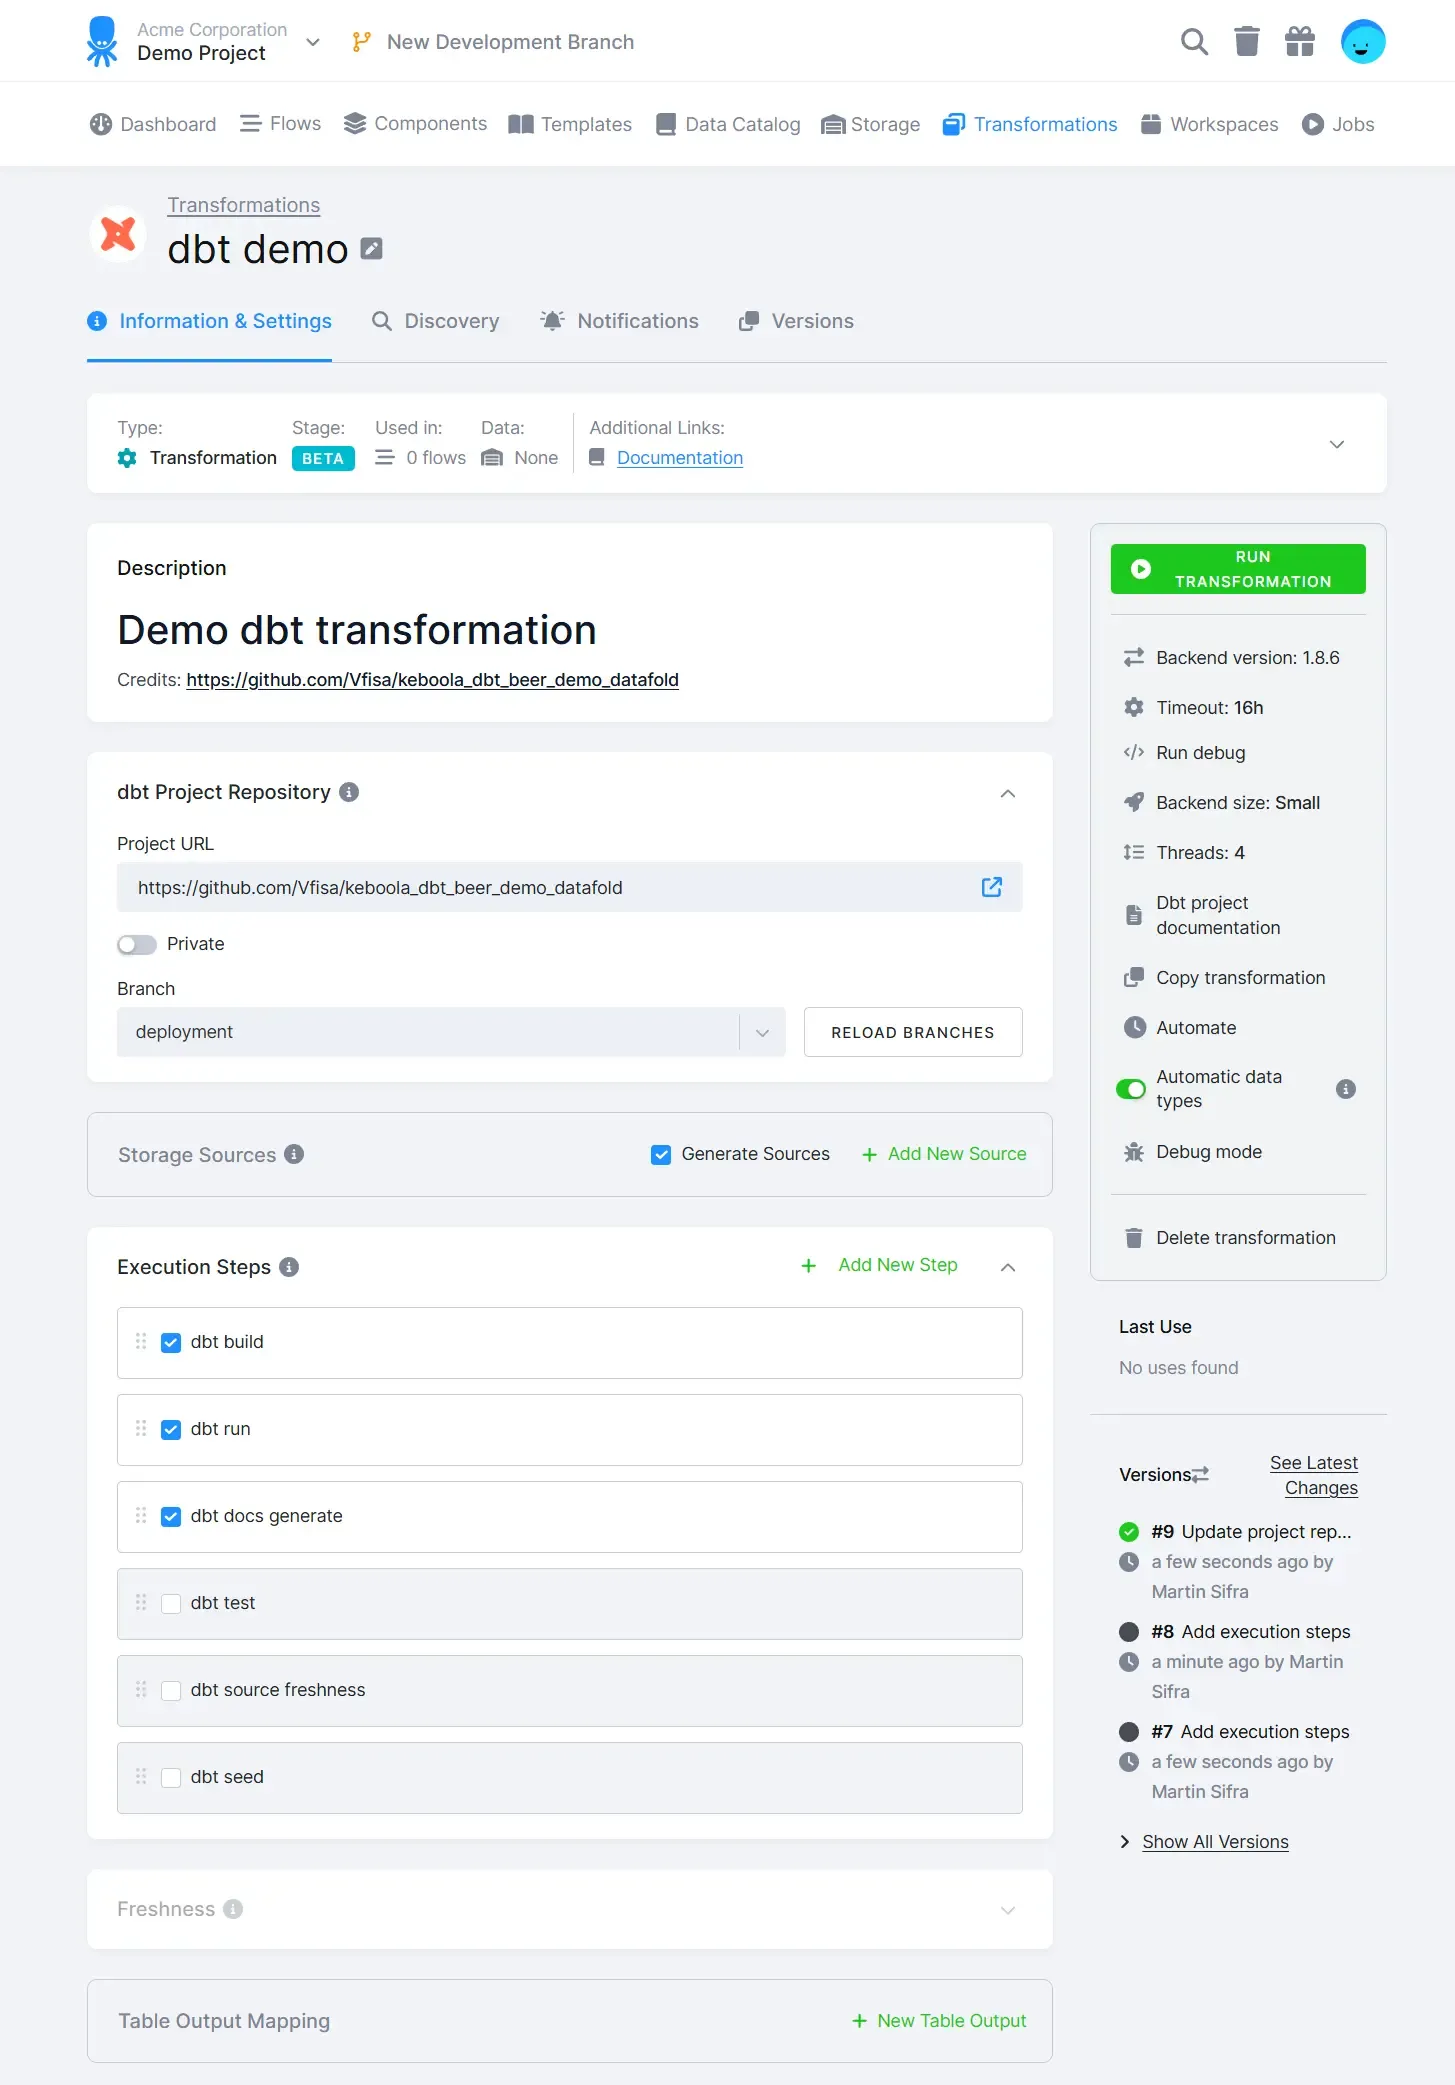
Database Connection
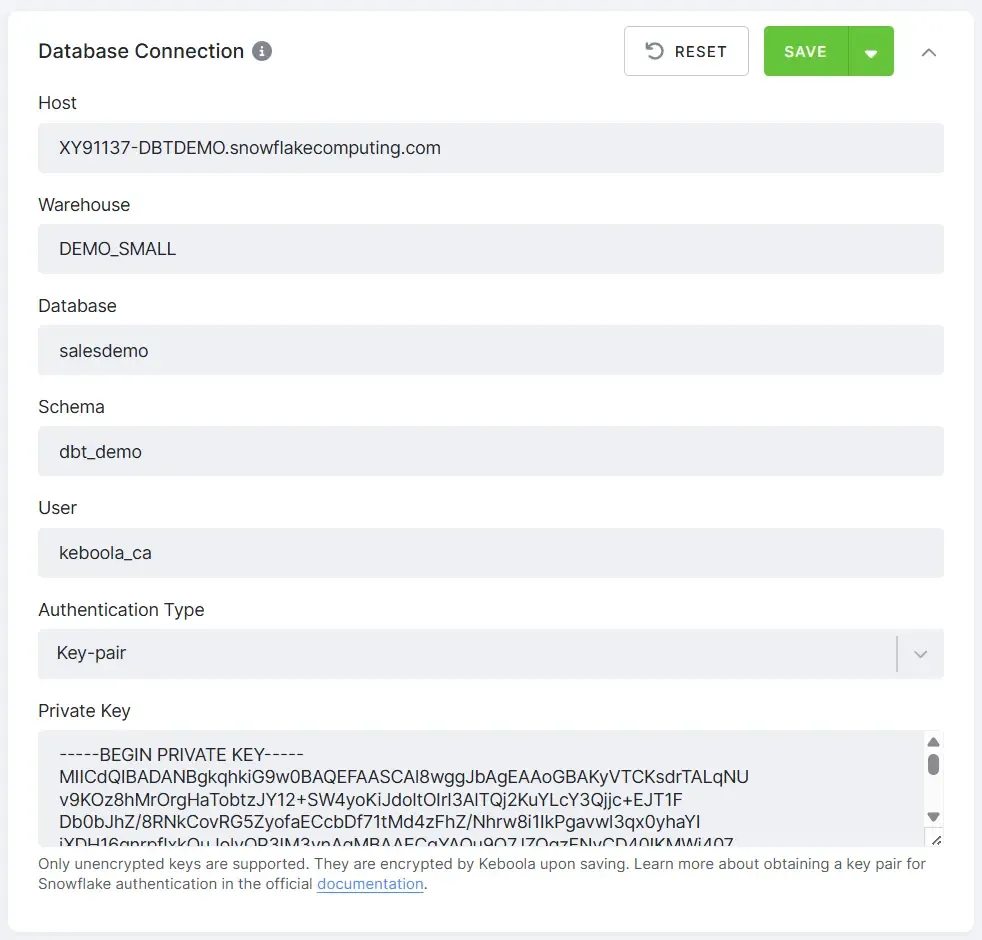
Section titled “Database Connection”The required connection parameters for your remote data warehouse vary depending on the selected backend type. Use the Run Debug option in the right panel to validate the connection using the entered parameters.
dbt Project Repository
Section titled “dbt Project Repository”First, you must define a repository by specifying the URL (ending with GIT) and entering the access credentials if required.
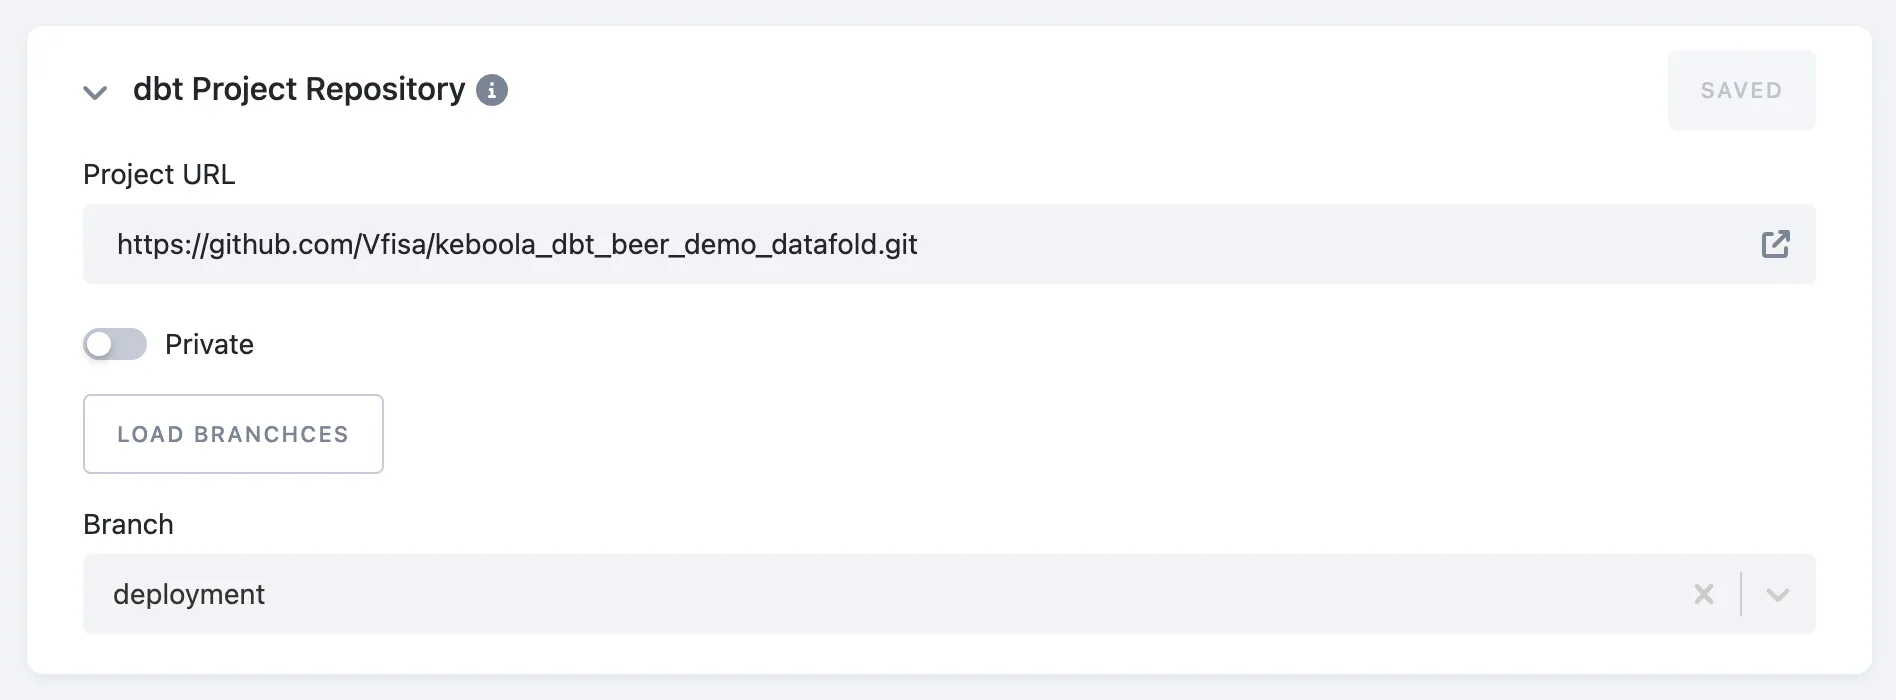
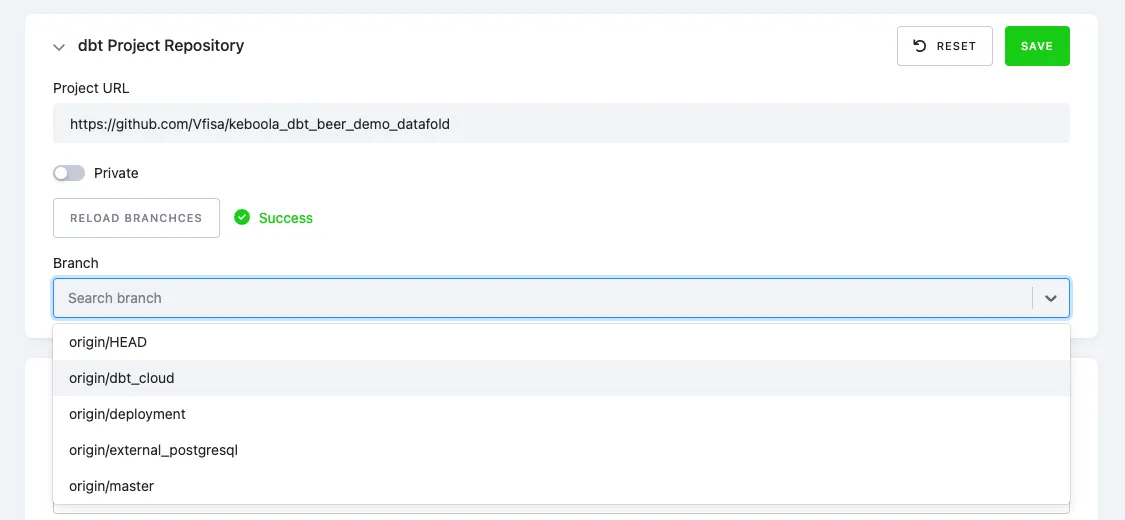
After saving a configuration, click Load Branches to select the desired branch. Don’t forget to click Save.
Execution Steps
Section titled “Execution Steps”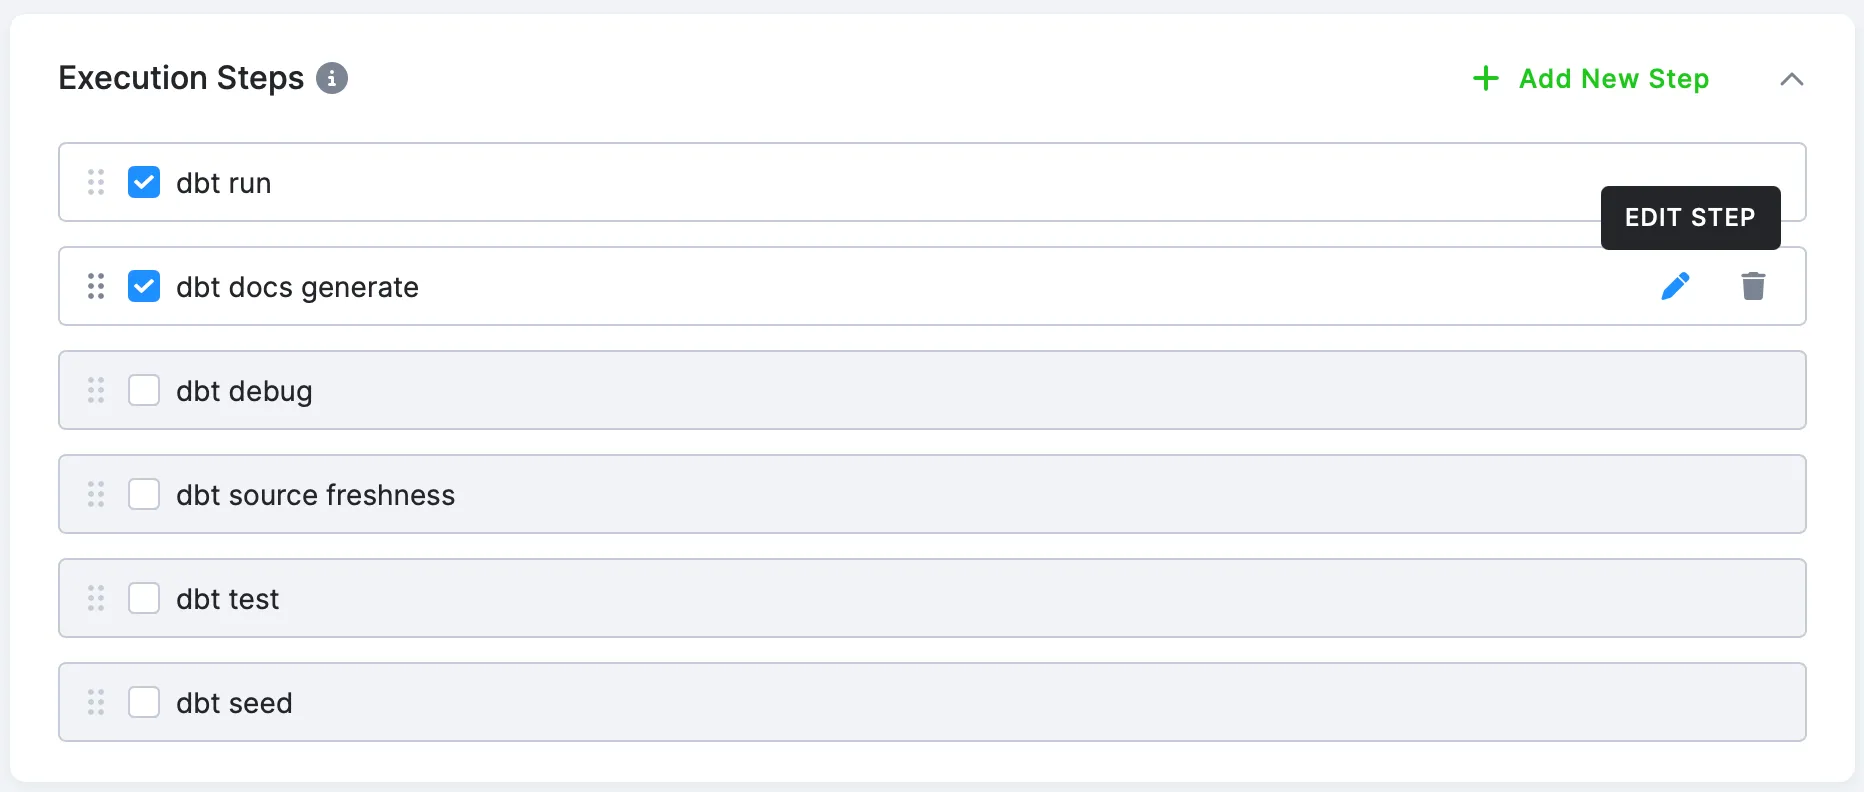
Select the desired execution steps, then edit or rearrange them as needed.
By editing individual steps, you can append flags or specify resources to the command. Available options vary depending on the command. Please refer to the documentation for details.
For example, you can use the following command:
dbt run --select "path:marts/finance,tag:nightly,config.materialized:table" --full-refresh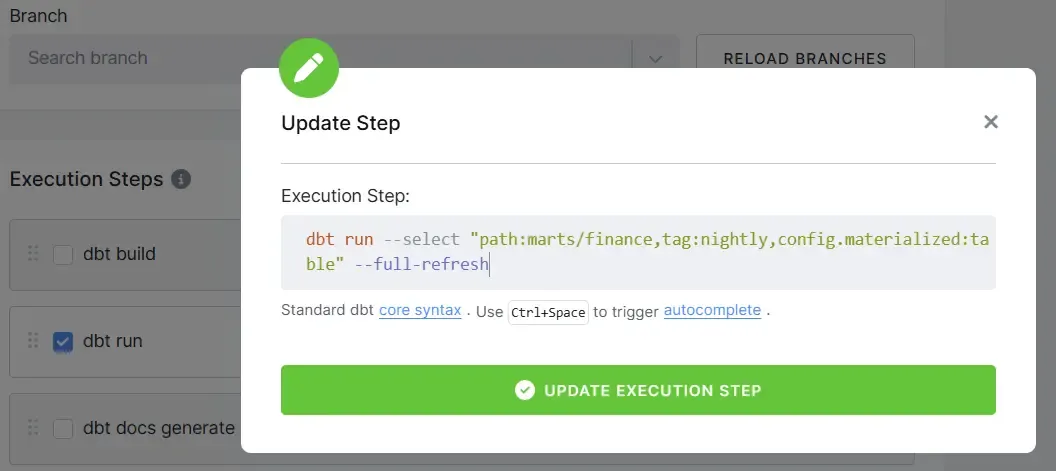
Freshness
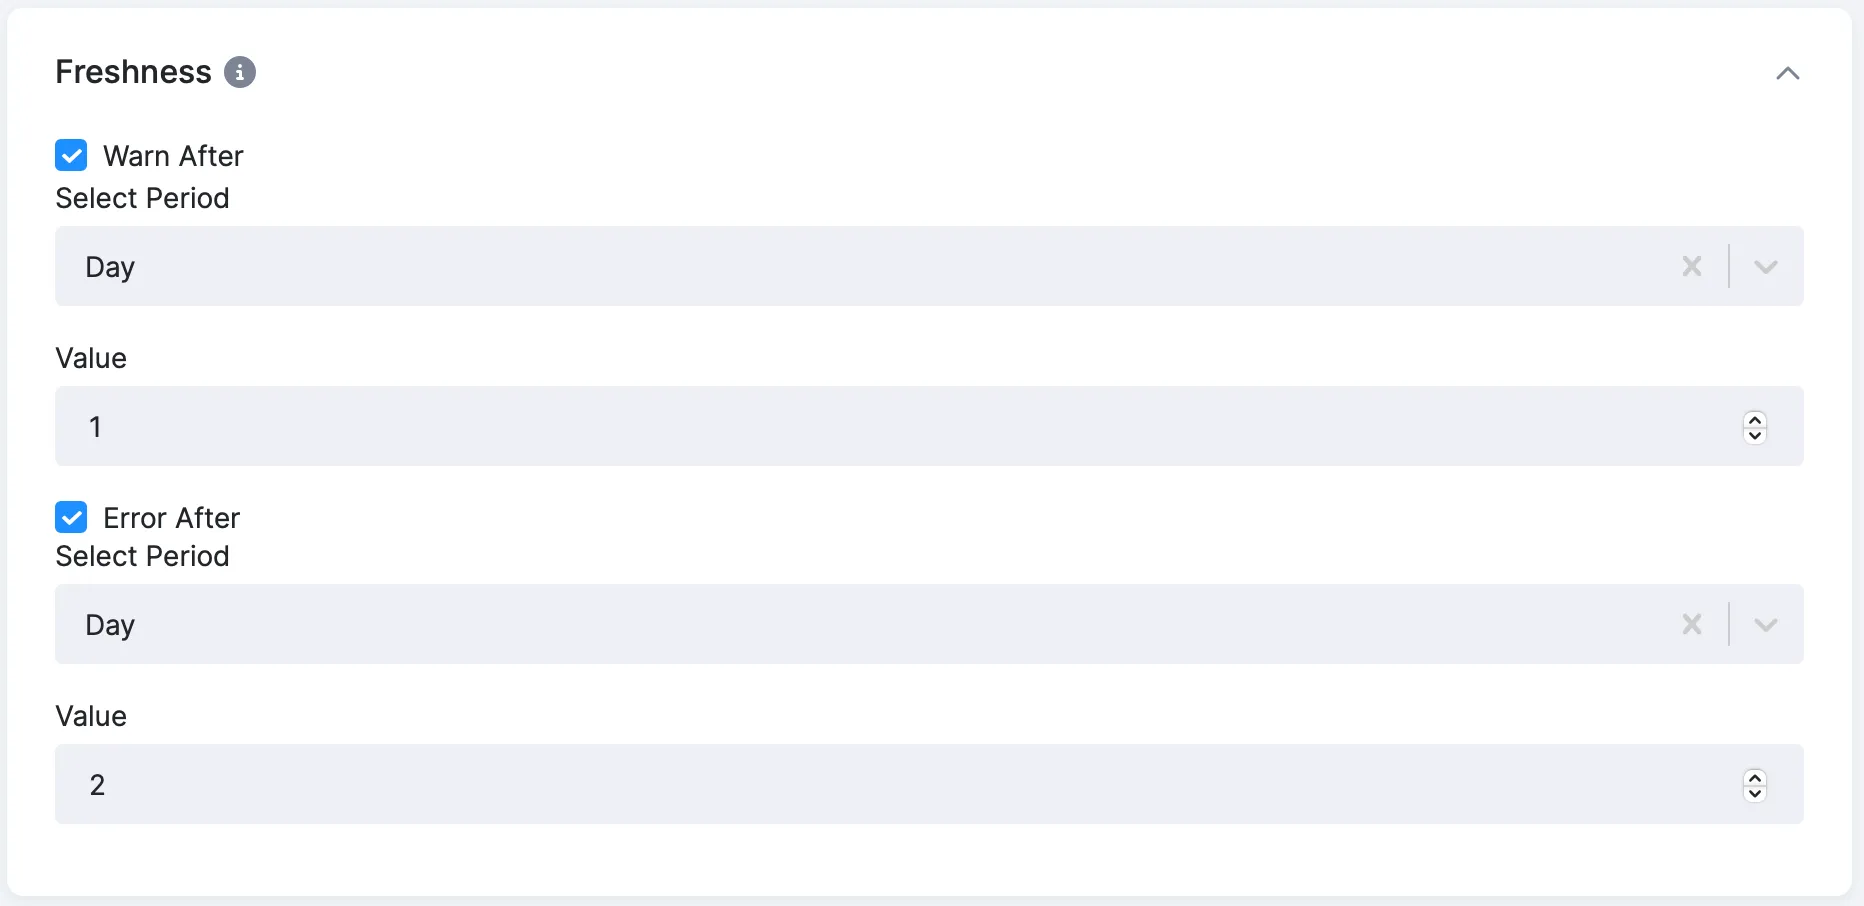
Section titled “Freshness”If you run the dbt source freshness step in your project, you can set time limits for displaying warnings and errors. Both time limits can be enabled and configured independently.
Artifacts
Section titled “Artifacts”Artifacts generated by dbt (all steps except dbt deps and dbt debug) are automatically stored in Keboola Storage. Depending on the configuration, they are saved either as a compressed ZIP file or as individual files.
Output Mapping (Keboola Storage Component Only)
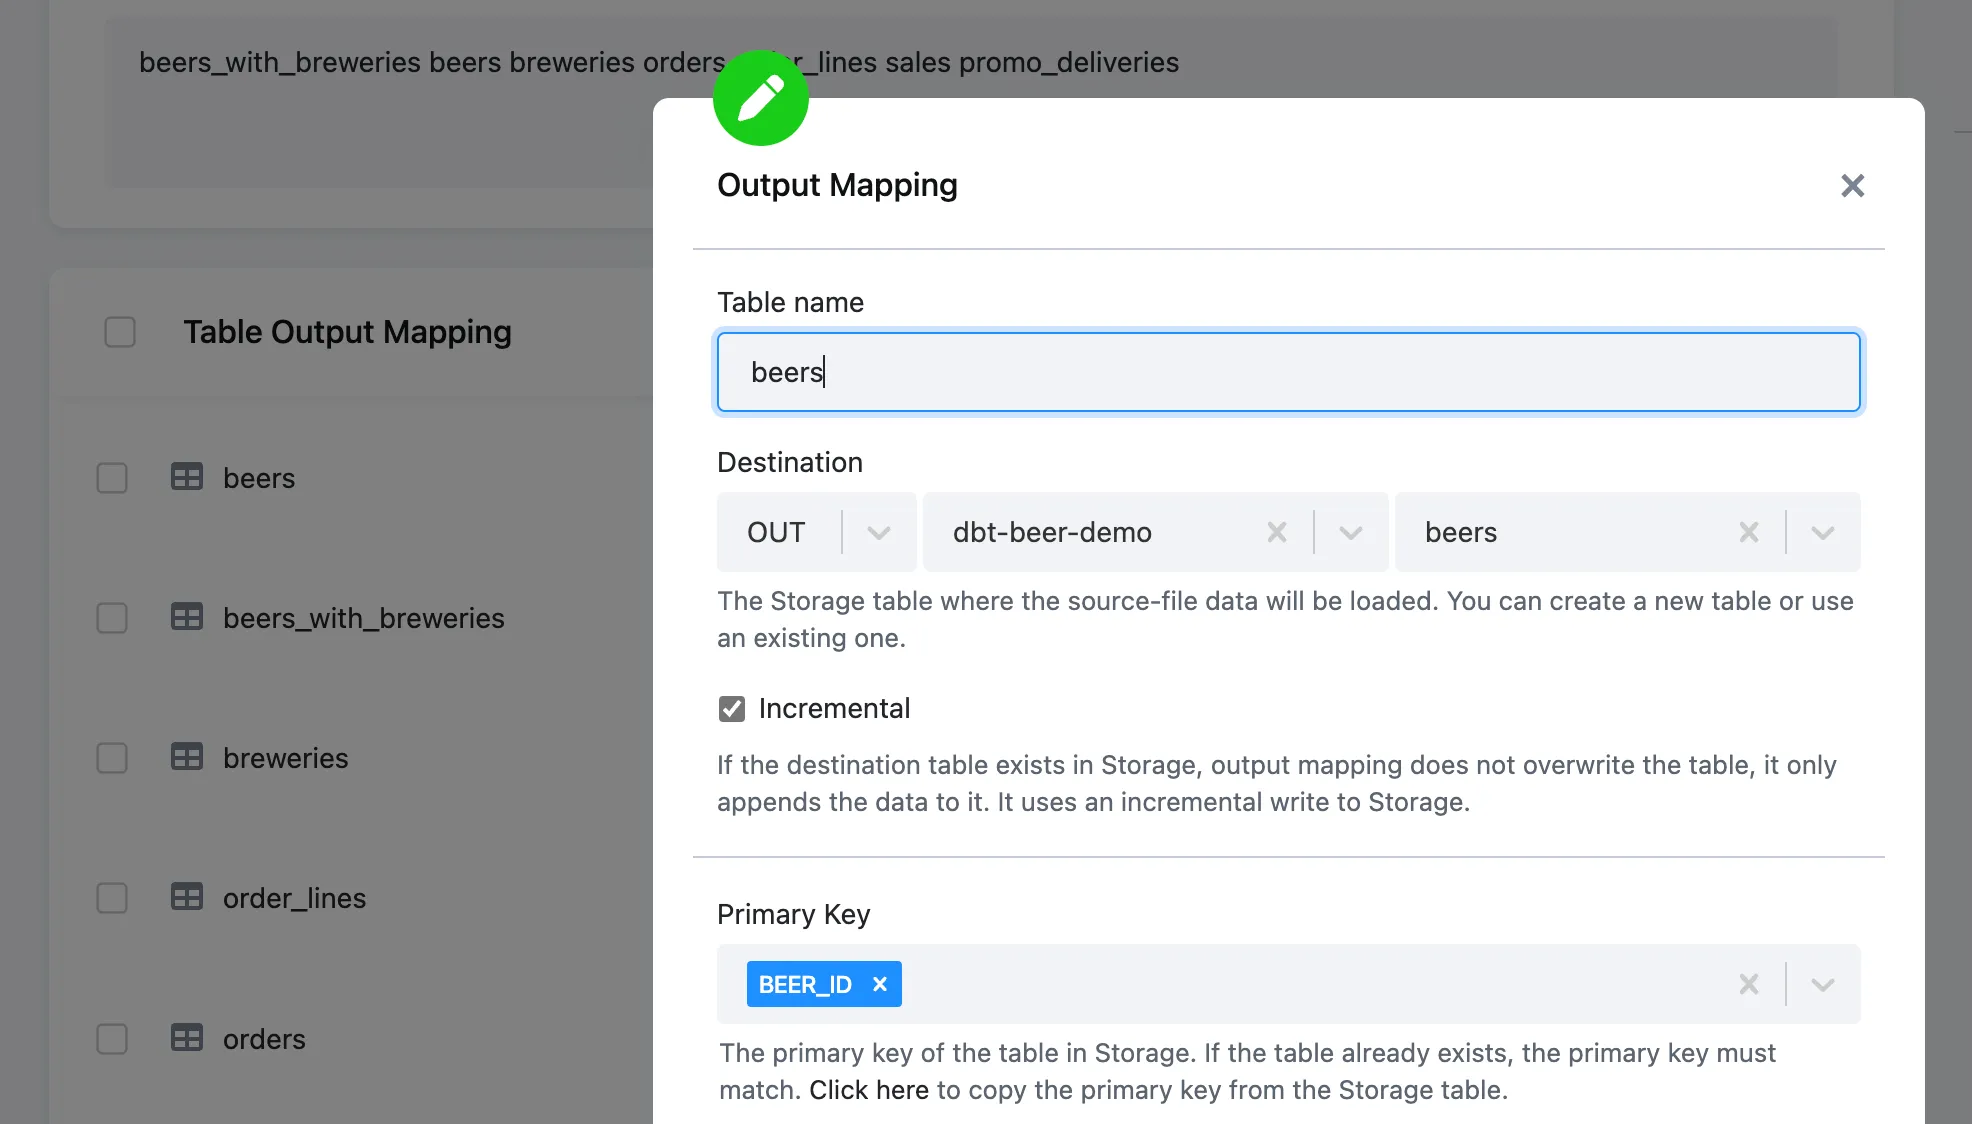
Section titled “Output Mapping (Keboola Storage Component Only)”This is a specific configuration needed for the Keboola dbt component. Define which tables will be imported within storage. This configuration uses a standard output mapping UI element with configuration options, such as incremental or full load, filters, etc.
Running transformation
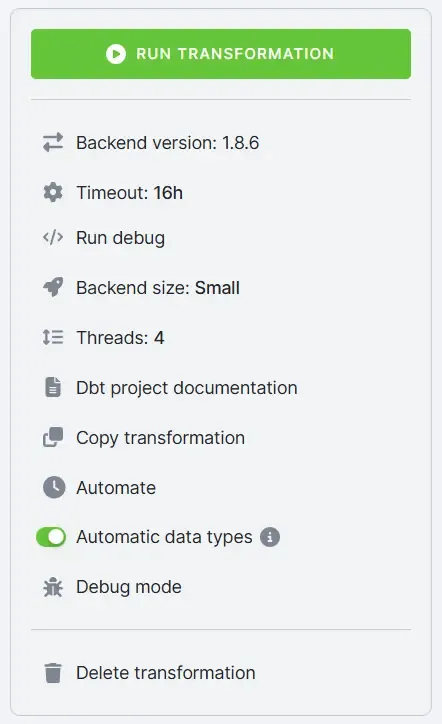
Section titled “Running transformation”Before running the dbt transformation, you can configure additional parameters (such as the dbt Core version, backend size, and number of threads), run debug command, or view generated project documentation.
Run Debug
Section titled “Run Debug”To verify that your credentials and project setup are correct, you can run a debug job. This is the same as running dbt debug from the command prompt.
The Run debug button will create a separate job with standard logging, exposing the results of the dbt debug command.
dbt Project Documentation
Section titled “dbt Project Documentation”When you press dbt Project Documentation, the job will generate the necessary files within artifacts to power documentation. The dbt documentation is then accessible via the button from the main configuration screen. Clicking the button synchronously generates the documentation in a popup.
Manually Triggering dbt Transformation
Section titled “Manually Triggering dbt Transformation”When you manually run a dbt transformation, a new job is triggered with standard logging and stores information such as:
-
Person (token) triggered job
-
Start, end, and duration of the job
-
Job parameters
-
Component execution log
-
dbt deps and repository information
-
Full dbt log for all steps defined
-
Storage output (Keboola dbt)
-
Record of producing and storing artifacts
You can also access all configuration jobs from the configuration screen and the Jobs menu section.
Discover
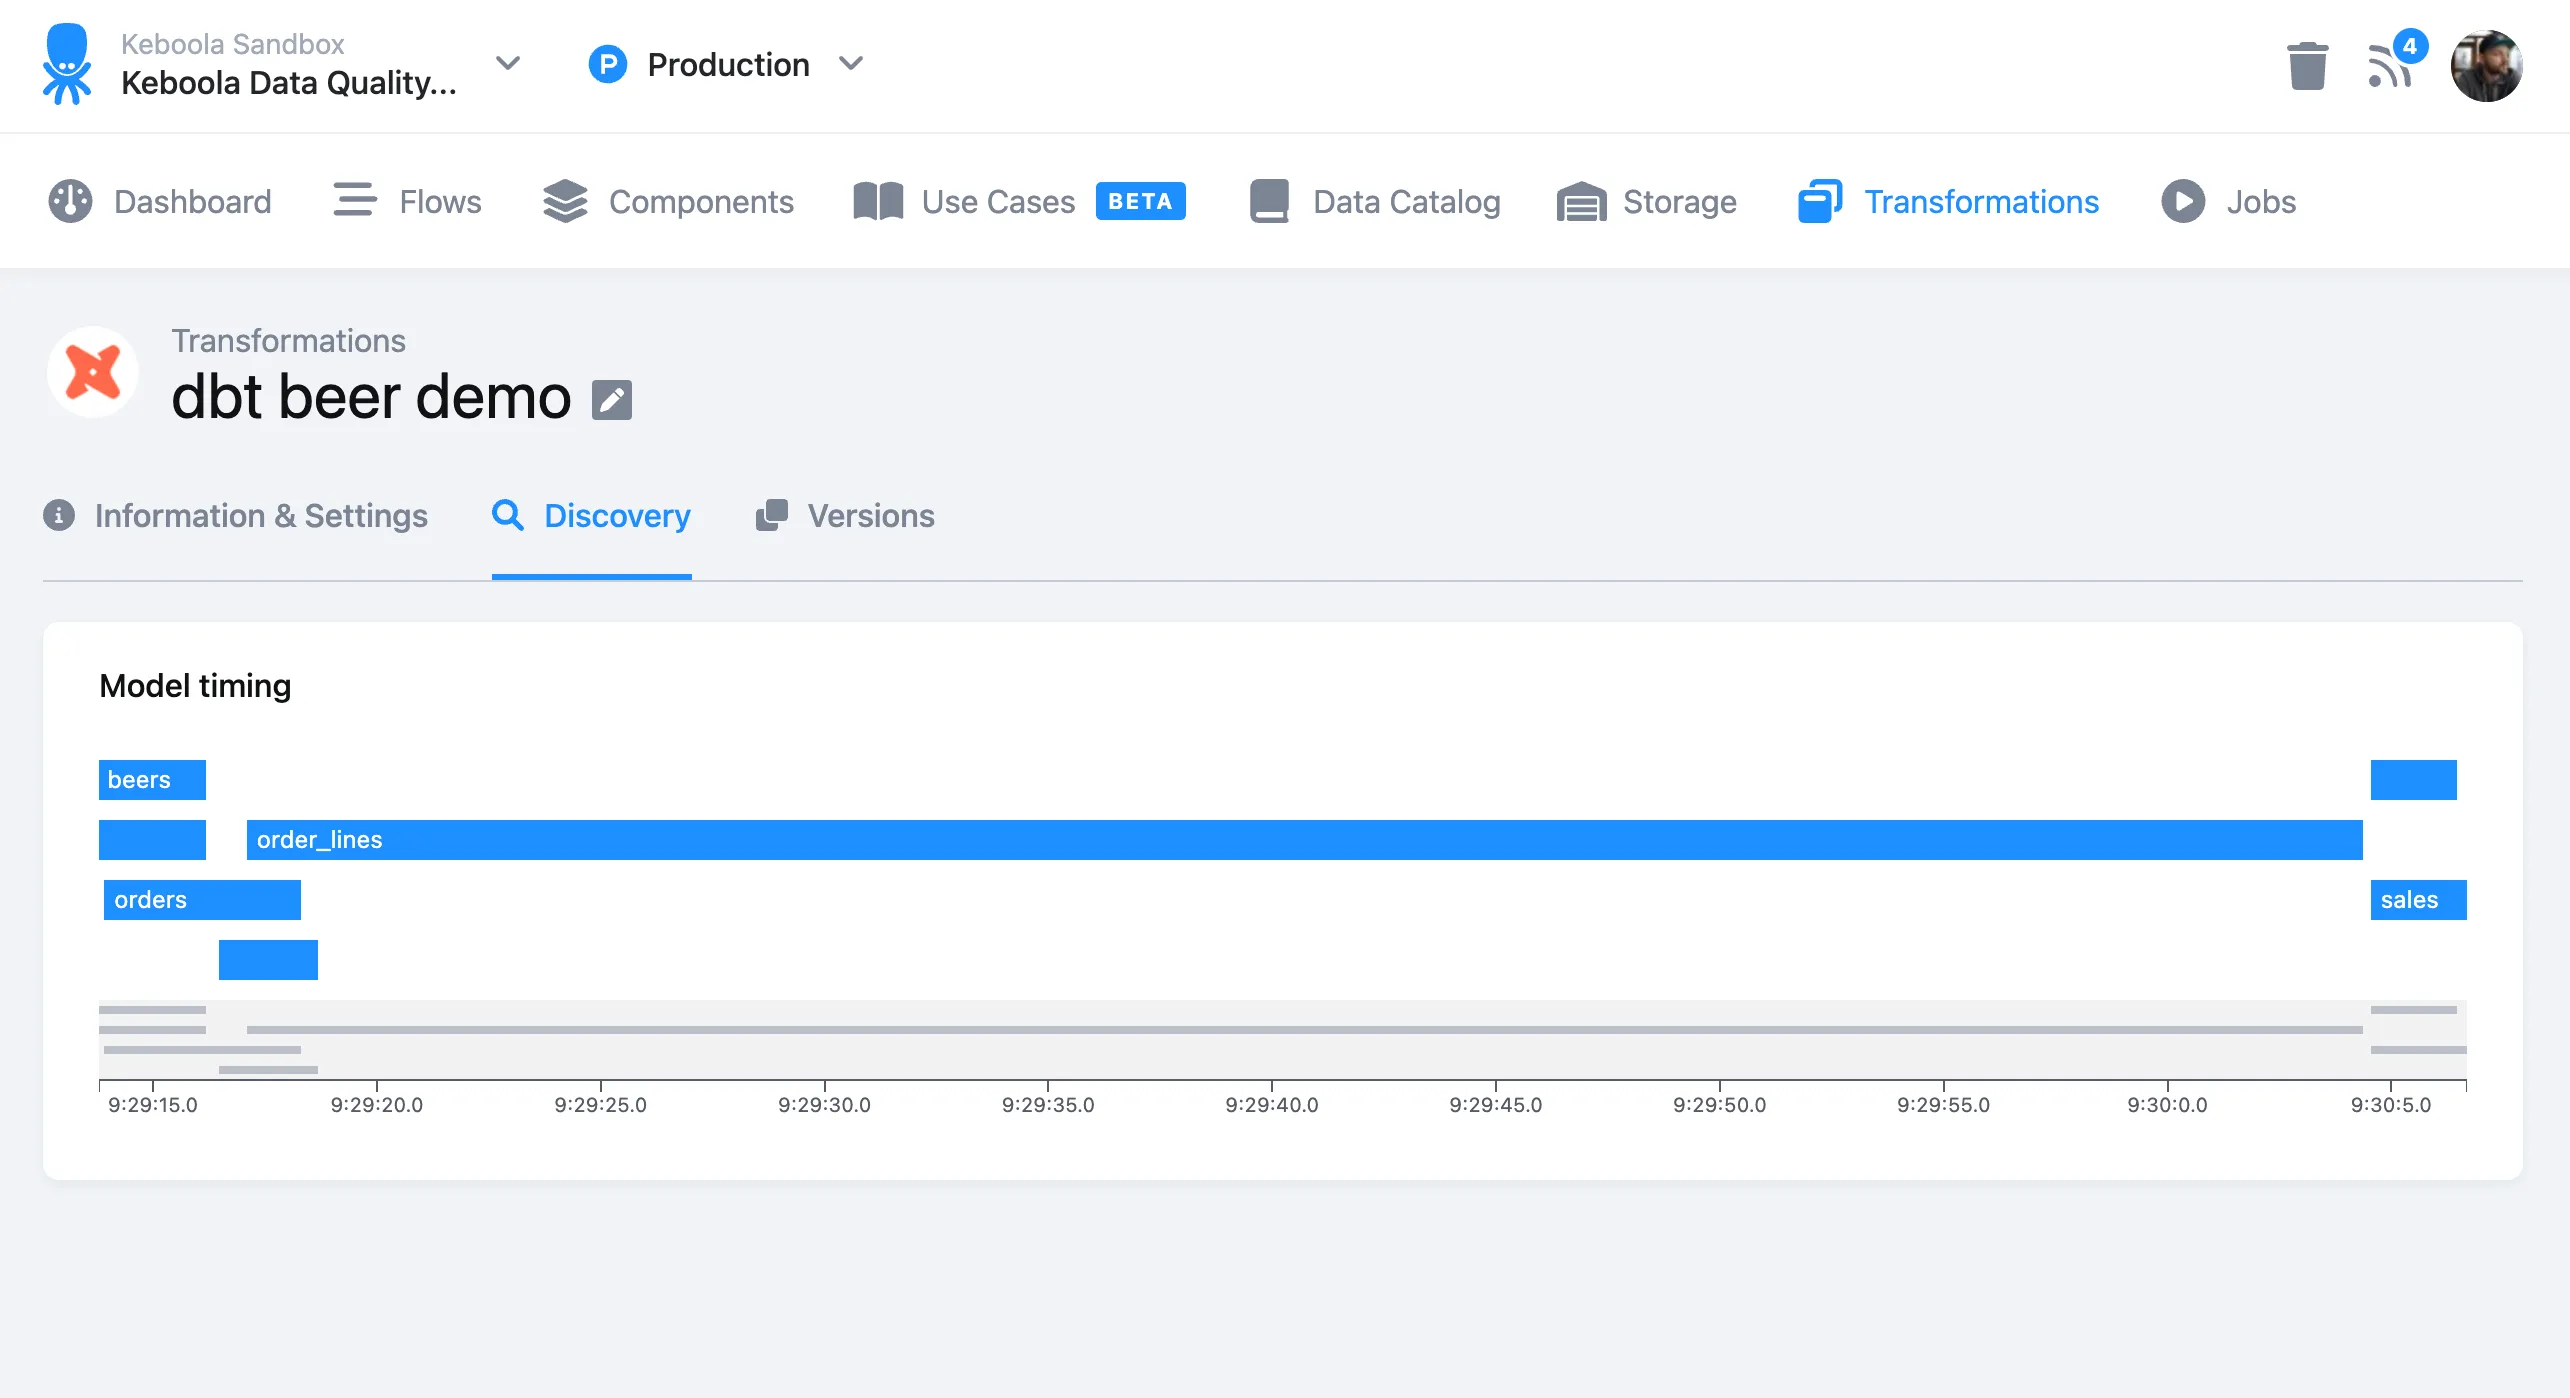
Section titled “Discover”The Discover tab is designed to provide more information about the run. Keboola plans to expand this tab to offer additional insights. Currently, it provides the timeline designed to visually display the duration of each model build.
Profiles and Target
Section titled “Profiles and Target”Keboola automatically generates a profiles.yml file for your dbt transformation. Here, you can see what the generated file looks like:
default: outputs: kbc_prod: type: '{{ env_var("DBT_KBC_PROD_TYPE") }}' user: '{{ env_var("DBT_KBC_PROD_USER") }}' private_key: '{{ env_var("DBT_KBC_PROD_PRIVATE_KEY") }}' # or use a deprecated password # password: '{{ env_var("DBT_KBC_PROD_PASSWORD") }}' schema: '{{ env_var("DBT_KBC_PROD_SCHEMA") }}' warehouse: '{{ env_var("DBT_KBC_PROD_WAREHOUSE") }}' database: '{{ env_var("DBT_KBC_PROD_DATABASE") }}' account: '{{ env_var("DBT_KBC_PROD_ACCOUNT") }}' threads: '{{ env_var("DBT_KBC_PROD_THREADS")| as_number }}' target: kbc_prodIf needed, you can use a profiles.yml file committed in your dbt project repository for Remote DWH components and set the target according to your requirements. In this case, you must use the environment variables mentioned above in the generated profiles.yml and specify the target in each executed step. Your committed profiles.yml file will be merged with the automatically generated version.